Personvern
Oversikt over personvern ved OUS.
In our genetic material, we find specific areas that can be analysed to produce a forensic DNA profile. Such DNA profiles can be used in connection with paternity tests, other kinship tests, and in the identification of deceased individuals.
DNA is found in all cells that have a nucleus. The DNA molecules are located in the nucleus as long thread-like structures (chromosomes).
We have a total of 23 pairs of DNA strands in each nucleus. One of the pairs, the sex chromosomes X and Y, determines the individual's sex.
The hereditary material carries the genetic information that is passed from one generation to the next. Half of our DNA is inherited from our mother and half from our father. Full siblings will therefore, on average, share 50 per cent of their genetic information, while cousins will share, on average, 25 per cent.
The DNA strands are composed of four different building blocks or bases – adenine (A), cytosine (C), guanine (G), and thymine (T) – bonded together in base pairs. The bases are repeated in various combinations. A gene is a small area of the DNA strand where the bases are assembled in a specific order and have a particular biological function.
Only a small part of the hereditary material contains genes that provide information about an individual's health and physical characteristics. Between the genes, there are many areas that have no known function. It is these areas (or loci, from Latin locus meaning place) that are used in forensic genetic analyses.
A DNA analysis to investigate kinship is therefore a different type of DNA analysis than that performed to analyse genes and detect diseases or disease risks.
Investigation of kinship is relevant in various contexts, such as in:
In forensic genetic analyses, so-called STR regions (STR markers) are examined. STR stands for Short Tandem Repeats. In these DNA regions, specific combinations of bases are repeated multiple times. The number of repetitions in a specific STR region varies from person to person. Each individual can have two identical or two different STR variants in a specific area, one from each parent.
The example in Table 1 shows how the DNA sequence (base order) appears in an STR region in two individuals, and how this sequence gives rise to the naming (nomenclature) of the variants. Individual 1 has variants 8 and 6, while individual 2 has only variant 7. This means that individual 2 has inherited the same variant from both parents.
Table 1. Number of GATA repetitions in an STR region in two individuals. Other STR regions may have a different composition of the repeated unit, such as AAAC or TAGC. G = guanine, A = adenine, T = thymine, C = cytosine.
Ind. No. An STR region with GATA repetitions Number
1 (GATA)(GATA)(GATA)(GATA)(GATA)(GATA)(GATA)(GATA) 8
(GATA)(GATA)(GATA)(GATA)(GATA)(GATA) 6
-------------------------------------------------------------------------------------------------------------------------------
2 (GATA)(GATA)(GATA)(GATA)(GATA)(GATA)(GATA) 7
(GATA)(GATA)(GATA)(GATA)(GATA)(GATA)(GATA) 7
In a paternity test, 23 such STR regions are usually examined, in addition to an area on the DNA strands that indicates the individual's sex. By analysing enough STR regions, one obtains a unique DNA profile that is characteristic of the individual. There is a very small chance that two unrelated individuals have exactly the same number of repetitions in all the analysed STR regions.
Some STR regions are referred to as complex regions and are characterised by consisting of several types of repeated units within the same STR region. Such STR regions typically show greater variation than simple STR regions. An example of a complex STR is the SE33 region (also called ACTBP2), where more than 50 different variants occur in the population. For simple regions, there will typically only be 8 to 10 different variants in the population.
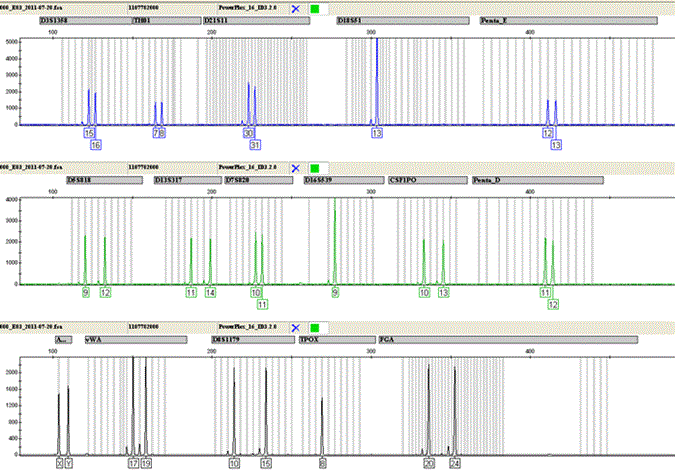
Illustration: OUS
Figure 1 shows the analysed data in the form of a so-called electropherogram. The horizontal grey fields above the curves show the name of the STR region. To the left in the bottom field, we see that the area marked Am (Amelogenin) shows an X curve and a Y curve, indicating that this DNA profile belongs to a man. A woman would only have X curves, as she has inherited an X chromosome from both her mother and father.
In a paternity test, the participants' DNA profiles are compared against each other. Essentially, there are two claims:
The frequency of the various STR variants in the population has been mapped through population studies. A likelihood ratio (Likelihood Ratio - LR), also referred to as the paternity index, is calculated, where the theoretical probability of the measured analysis results under each of the two claims is presented as a fraction. The probability of the data given Claim 1 is in the numerator, and the probability of the data given Claim 2 is in the denominator.
Each STR region is assessed individually, and since the regions are inherited independently of each other, the fractions for each region can be multiplied. This gives a combined likelihood ratio (LR), which indicates the extent to which the analysis results collectively support one claim over the other.
If the LR is greater than 1, the analysis result supports Claim 1 more than Claim 2. If the LR is less than 1, the analysis results support Claim 2 more than Claim 1.
A likelihood ratio (LR) with today's analytical methods will typically be either:
or
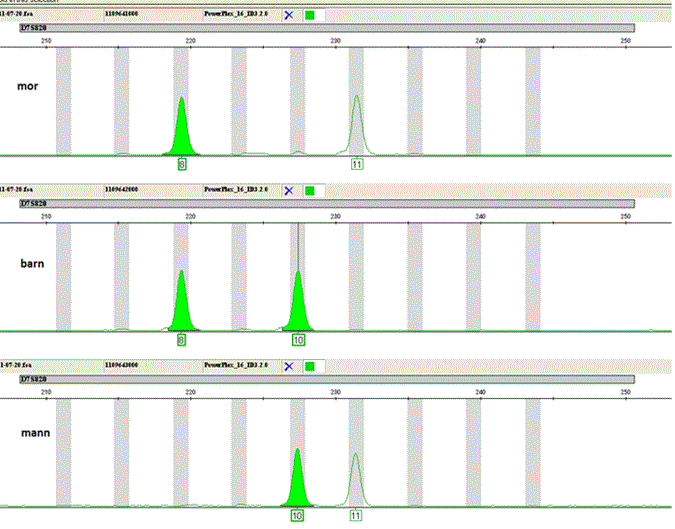
Illustration: OUS
In the STR region D7S820 in Figure 2 above, the child has inherited variant 8 (that is, eight repetitions) from their mother and variant 10 from their biological father. This variant is found in the tested man. The frequency database shows that 14 per cent of the Norwegian population has variant 10. The likelihood ratio (LR) for this region is 3.57, thus supporting that the man is the child's father compared to another unrelated man being the father.
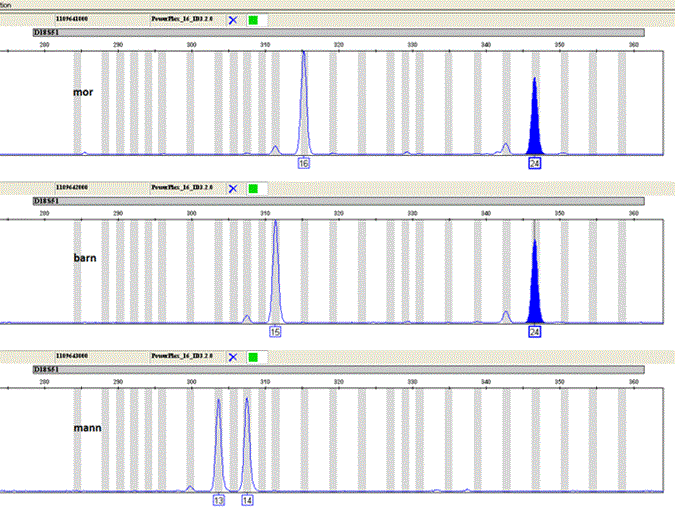
Illustration: OUS
In the STR region D18S51 shown in Figure 3 above, the child has inherited variant 24 from their mother and variant 15 from their biological father. Variant 15 is not found in the tested man. The likelihood ratio (LR) is 0.0017, thus supporting that another unrelated man is the father of the child compared to the tested man being the father.
When the likelihood ratio (LR) is 0.0017 (and not zero, which would exclude paternity), it primarily indicates that the result in this STR region could also be due to a change in the DNA strand during cell division when the sperm cell was formed. If this has occurred, the child will have a different STR variant than the father has in his somatic cells. We say that a mutation has occurred. Such mutations occur with a certain, but low frequency in all STR regions. The occurrence of mutations explains the genetic variation found in the population, which has developed over time.
If there are three or more such genetic incongruences between the child's STR variants and the man's variants in the 23 examined areas, there is very little chance that this can be explained by mutations. The likelihood is so small that the analysis excludes that the man is the father of the child.
A standard paternity test at Oslo University Hospital, Section for Forensic Genetics - Kinship and Identity, includes at least 23 STR regions. Table 2 shows an example of results for the mother, child, and two paternity candidates for a selection of the 23 regions.

Figure: OUS
Based on the combined likelihood ratios (paternity indices) in the table above, the results provide grounds for the following conclusions:
Man 1: The results of the DNA analysis indicate a very significant probability weight (at least 1,000,000:1) that man 1 is the father of the child, compared to another unrelated man being the father. Assuming that the prior probability is equal for both claims, the DNA analysis provides a probability of at least 99.9999% that man 1 is the father of the child.
Man 2: The results of the DNA analysis indicate such a strong probability weight for another unrelated man being the father, compared to man 2 being the father, that it is considered excluded that man 2 is the father of the child.
A kinship test can have various purposes. If it concerns an unresolved paternity for a child, and the man is not available for analysis, it may be relevant to test close relatives of his instead. If a close kinship is established between the child and, for example, the man's siblings, conclusions can be drawn about the man's paternity based on this.
The number of close relatives participating and their kinship relationship to the man will affect the outcome of the test. The evidential value for or against kinship will increase with the number of participants. Weight of evidence calculations are made based on relevant claims, and the likelihood ratio (LR) indicates whether the analysis supports the claimed kinship or not, and with what probability weight. With the help of additional analyses, it may be possible to arrive at a definitive answer in many cases, but not always.
A kinship test can also be used to establish, for example, a sibling relationship or a mother-child relationship. The latter test is most relevant in connection with the need to present documentation of kinship to the population register or immigration authorities.
Examples of other kinship tests performed by the section include grandparent-grandchild, aunt/uncle-niece/nephew, full sibling test, half-sibling test, and cousin test.
All routine methods and expert reports at the section are accredited according to ISO 17025. As part of the internal quality assurance, each sample is analysed in at least two independent tests with overlapping areas. This ensures that any errors or mix-ups within the laboratory are detected.